MysteryQuest 7
Support Materials 3 (Briefing Sheet)
Creating a Pie Chart
Example
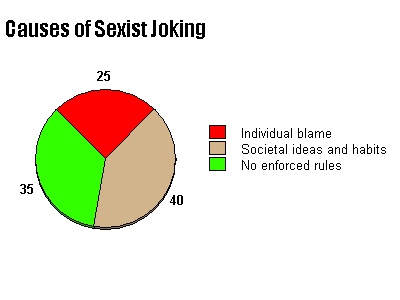
A teacher talks to her class about a sexist joke she overheard on the school bus told by a very young student. The class decides that the person was wrong to do it but that the student’s age suggests the action was clearly influenced by the fact that it is cool to tell these jokes and to a lesser extent by the school’s failure to actively discourage this kind of behaviour. They draw a pie chart to reflect the extent to which this action was influenced by each factor.
Attribute percentage of responsibility
| Individuals: personal blame of individual who told the joke | 25% | |
| Ideas: societal habits and ideas | 40% | |
| Institutions: no enforced rules against sexist jokes | 35% | |
| _____ | ||
| 100% |
Calculate the angle for each factor
| Individuals: | 25% x 360o = | 90o |
| Ideas: | 40% x 360o = | 144o |
| Institutions: | 35% x 360o = | 126o |
| _____ | ||
| 100% |
Draw the pie chart
Use a compass and protractor to draw your pie chart manually. Websites can help you draw the chart electronically. The following pie chart was created on https://nces.ed.gov/nceskids/Graphing/classic/pie.asp.